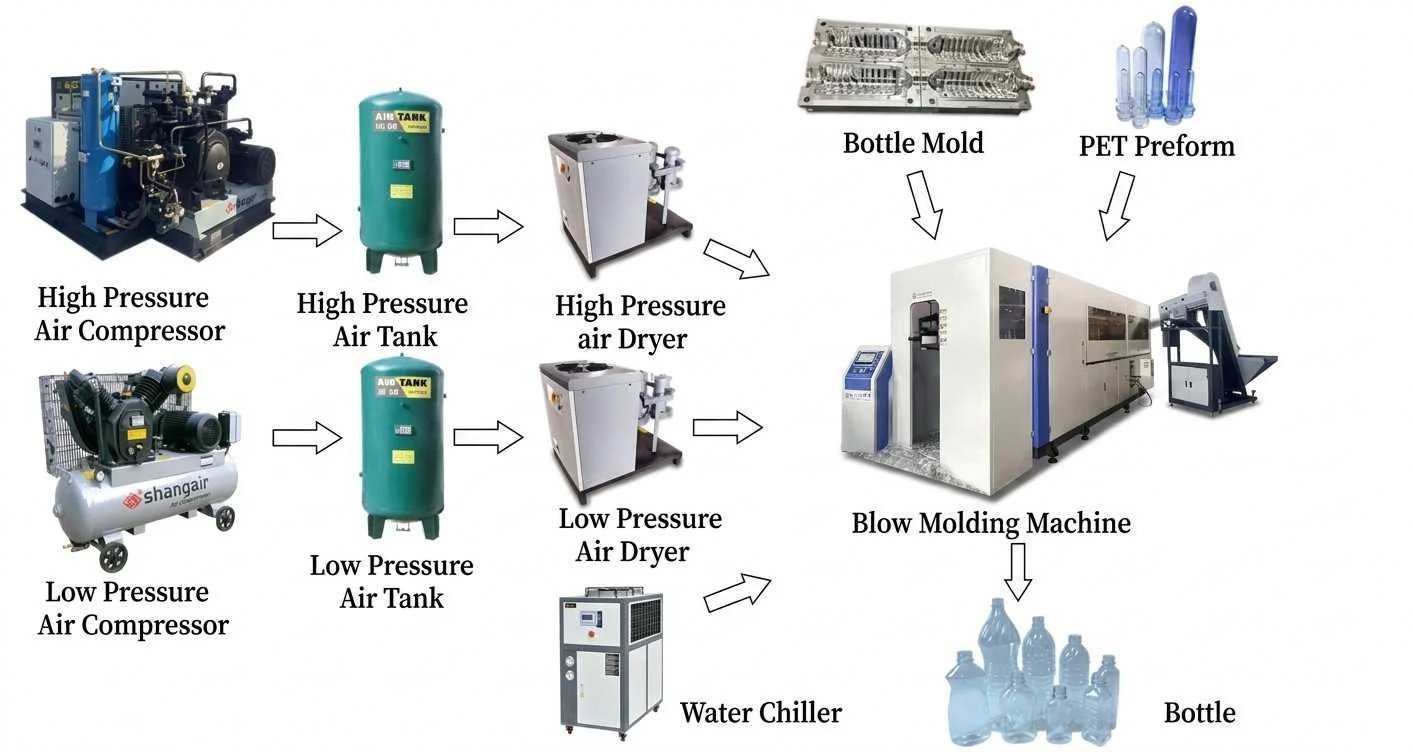
PET blow molding energy consumption is the running cost that decides whether a machine is a good buy, and it is almost always the least examined number in a purchase decision. Machine offers are compared on price, cavity count, output and delivery. The electricity, compressed air and chilled water the machine will consume every hour for the next decade are usually described in a single sentence with no basis shown — or omitted entirely, on the assumption that the buyer will not ask.
The cost of that omission compounds. A machine chosen on capital price alone can consume meaningfully more per thousand bottles than an alternative that costs slightly more, and the difference is paid every month for the life of the asset. On a plant running three shifts, running cost overtakes purchase price within a small number of years, and after that everything the plant saves on capital is being handed back to the utility provider and the compressor service company.
Sailwin has delivered PET stretch blow molding machines into 500+ installations across 60+ countries over 15+ years, manufacturing under ISO 9001:2015 with CE marking and providing a 2-year whole-machine warranty with 7×24 remote support and spare parts dispatched within 48 hours. Machines run preform heating between 90 °C and 115 °C under PID control holding approximately ±1 °C, blow at 25–40 bar, and monitor 40+ parameters in real time through the PLC. This guide sets out how to build a defensible energy figure per thousand bottles, where the energy actually goes, and which measures deliver the largest return.
Key Takeaways
- A meaningful figure includes compressed air and chilled water, not just the machine’s electrical draw. Excluding utilities makes every machine look similar and hides the largest differences.
- The comparison must be per 1,000 bottles at a defined bottle weight and cavity count. Quoting kilowatts per machine compares nothing, because machines are not the unit of production — bottles are.
- Two measures — high-pressure exhaust recovery and correct pressure and temperature settings — usually beat everything else. High-pressure exhaust recovery alone reduces compressor load by approximately 20%.
Build an Energy Figure for Your Bottle and Output
Send the bottle weight, cavity count and target output — our engineers return the machine configuration with the energy basis and factory-direct pricing within 24 hours.
1. What a Proper Energy Figure Has to Include
Most energy claims compare the electrical consumption of two machines and stop there. That is the wrong boundary. A PET blow molding cell is a small system, and three utilities have to be counted together because they trade against each other: if you reduce compressed air pressure you may need more cooling, if you speed up the cycle you may need more air, and if you lower mould temperature you increase chiller load significantly.
| Boundary | What it includes | Why it matters |
|---|---|---|
| Too narrow | Machine electrical draw only | Favours machines that shift load onto compressed air or cooling, and ignores the largest load in most plants |
| Practical | Machine electrical load + compressed air consumption + chilled water load, all per 1,000 bottles at the same bottle weight and cavity count | Comparable between offers and traceable to a meter, which means the claim can be verified after installation |
| Ideal | Practical boundary plus reject rate and start-up losses, expressed as energy per 1,000 saleable bottles | Reveals machines that look efficient on output but generate more scrap, which is energy spent on bottles nobody sells |
The practical boundary is the one worth insisting on. It requires the supplier to state a bottle weight, a cavity count, an output in bottles per hour and an assumed utility basis — and once those four things are stated, the number can be compared honestly and checked against a meter after commissioning. Where a supplier cannot state them, the energy claim should be treated as marketing rather than engineering.
2. Where the Energy Goes in a PET Blow Molding Cell
The share of energy taken by each load varies with bottle size, cavity count, cycle time and local climate, so the table below describes behaviour and relative significance rather than fixed percentages. What is consistent across plants is which loads are controllable and which are not.
| Load | Behaviour | Controllability |
|---|---|---|
| Compressed air generation | High-pressure blowing air at 30–40 bar delivered in short bursts, plus low-pressure air at 8–10 bar. Frequently the largest single electrical load attributed to the cell | High. Pressure levels, exhaust recovery and leak elimination are all directly addressable |
| Preform heating | Continuous load held between 90 °C and 115 °C under PID control at approximately ±1 °C. Runs whenever the machine is ready, not only when a bottle is made | Medium. Correct zone control and insulation help; the load itself is inherent to the process |
| Mould and machine cooling | Chillers holding mould circuits typically between 8 °C and 12 °C, plus hydraulic oil cooling. Runs continuously while the machine is in production | High. Setting cooling to the process requirement rather than colder, and insulating circuits, both reduce load |
| Servo and hydraulic drives | Carriage, clamping and stretch movements. Servo drive configurations are quoted at up to 30% energy saving against standard hydraulics | Decided at purchase. Once the machine is built, this lever is largely fixed for its life |
| Rejects and start-up | Bottles produced and discarded consume the full energy of production with no revenue, including during warm-up | High. Reduced by process stability and by cutting mould change time below 30 minutes |
The loads that are decided at purchase are the ones that cannot be fixed later. That is the argument for spending specification effort on the drive configuration and air system before signing, and on everything else afterwards.
Check Your Air, Cooling and Drive Configuration
Send your current utility readings and machine settings — our engineers will identify which loads are out of line and what to change first.
3. The Five Highest-Return Efficiency Measures
These are ordered by the ratio of saving to difficulty. The first two are close to free and apply to existing machines as well as new ones; the fourth is decided at purchase and cannot be retrofitted cheaply.
1. High-pressure exhaust recovery
High-pressure blowing air is normally vented to atmosphere when the blow is complete. Recovering that exhaust for reuse reduces compressor load by approximately 20%. On a cell where the compressor is the dominant electrical load — which is the common case — this is the single largest available reduction, and it requires no compromise in the blowing process.
2. Eliminating air leaks and unnecessary supply pressure
Compressed air leaks are continuous and invisible. A leak survey and repair programme costs almost nothing and reduces the base load the compressor carries twenty-four hours a day. Alongside it, confirm that high-pressure air is supplied at 30–40 bar and low-pressure air at 8–10 bar, and that neither is set above what the process requires. Raising pressure to compensate for a leak is a common and expensive habit.
3. Setting cooling to the process requirement
Mould cooling circuits typically run between 8 °C and 12 °C. Each degree colder than necessary adds chiller energy disproportionately, because the chiller’s efficiency falls as the evaporating temperature drops. Determine the cooling temperature from the bottle’s cooling requirement and the cycle time, insulate mould manifolds and pipework, and stop cooling circuits that are not in use.
4. Specifying servo drive where the duty cycle supports it
Servo drive configurations are quoted at up to 30% energy saving against standard hydraulics, because power drawn follows demand instead of being dumped across a relief valve. The upper end belongs to machines with substantial low-demand portions in the cycle and to plants running long hours. This is a specification-time decision: retrofitting a drive architecture later is not a realistic option, so the assessment has to be made before the order.
5. Reducing rejects and start-up losses
Every rejected bottle consumed full production energy. Reducing rejects comes from process stability rather than from any single component: heating held under PID control at approximately ±1 °C, blow pressure held within its window, and mould temperature held at the correct level. Cutting mould change time below 30 minutes reduces the number of low-efficiency start-up periods in a week, which on a plant running several format changes is a meaningful saving. Sailwin machines monitor 40+ parameters in real time, which is what makes it possible to see which parameter moved when the reject rate changes, rather than adjusting several at once.
4. Building Your Own kWh per 1,000 Bottles Figure
Rather than relying on a supplier’s number, build your own from a meter. The method is a three-step calculation, and the only inputs it needs are ones you already have.
- Step 1 — total cell kilowatt-hours over a measured period. Meter the machine, the compressor serving the cell and the chiller serving the mould circuits separately over the same window. Separating the three is what tells you where to act.
- Step 2 — count saleable bottles in the same window. Count bottles that passed inspection, not bottles produced. This is the step that separates a well-run plant from a fast one.
- Step 3 — divide, then normalise. kWh per 1,000 saleable bottles, stated alongside the bottle weight, cavity count and product. A figure without those three is not comparable to anything.
As an illustration of the arithmetic rather than a benchmark, consider a cell whose total metered consumption across machine, compressor and chiller is 45 kW while it produces 4,000 bottles per hour. That is 11.25 kWh per 1,000 bottles. If the same cell runs on a higher bottle weight or a larger cavity count, the figure will differ, and comparing it against a different bottle is meaningless. The value of the calculation is not the absolute number — it is that the number is yours, it is measurable, and it lets you test whether a change actually helped.
Once you have a baseline, run the comparison as a controlled experiment. Change one measure from the list above, hold everything else, and re-measure over the same period length. High-pressure exhaust recovery and leak elimination will show up quickly. Cooling setpoint changes and servo drive behaviour need longer measurement windows because they interact with ambient conditions and production mix. The machines’ own PLC records help here: because 40+ parameters are logged in real time, a change in energy consumption can be matched against a change in machine state rather than attributed to the weather.
5. Case Study: Comparing Two Machine Offers on Running Cost
A bottler expanding a water line was comparing two PET blow molding offers where the more expensive option claimed lower energy consumption, but neither offer stated the basis for the claim.
- Two offers claimed different energy consumption with no bottle weight, cavity count or output stated for either claim
- Compressed air and chilled water treated as site overheads rather than as part of the machine comparison
- No existing metering on the current line, so there was no baseline to compare either offer against
- Both offers restated on one basis: per 1,000 bottles at an identical bottle weight and cavity count
- Metering installed on the existing line to establish a baseline before any new machine was specified
- Air and cooling loads included in the comparison, with exhaust recovery specified as part of the machine scope
- Mould change time treated as an energy parameter, because start-up periods consume production energy without producing saleable bottles
- The energy claims became verifiable rather than rhetorical, because both were reduced to the same unit of production
- The baseline changed the decision, showing that a significant portion of existing consumption came from the air system rather than the machine
- Running cost became auditable annually, because the metering installed during the project remained in place after commissioning
Scenario based on a Sailwin customer project; site-specific figures available on request during engineering review.
Frequently Asked Questions
Get an Energy Basis You Can Verify on Your Own Meter
Send your bottle drawing, container sample or target output. Our engineering team replies with a machine recommendation, mould assessment and factory-direct quotation within 24 hours.
Related Reading:
• PET Blow Molding Machines — 2-cavity to 8-cavity models
• Electrical and Utility Requirements for PET Blow Molding
• Mould Cooling Water Control for PET Bottles
• PET Blow Molding OEE: Benchmarks and How to Measure
• Servo-Hydraulic vs Standard Hydraulics: Real Energy Savings
• How Much Does a PET Blow Molding Machine Cost?