OEE is the number most often quoted in capital requests and the one most often calculated in a way that makes the request unnecessary. A plant reporting high OEE cannot justify a new machine, so the measurement quietly becomes favourable: planned stops are excluded, start-up losses are treated as commissioning, and rejects are counted as production until the QC gate rejects them. The result is a plant that believes it is running at capacity while regularly failing to deliver on time.
The cost of mis-measuring is not academic. Buying capacity when the real problem is start-up losses means paying capital to solve a discipline problem, and the new machine inherits the same losses on a larger scale. The reverse error is just as expensive: a plant that never measures cavity-level output can convince itself that a tool running 56 of 64 positions is performing normally, when a fifth of its capacity is sitting idle inside a machine it already owns.
Sailwin has built injection moulding machines for 15+ years, with 500+ machines delivered into 60+ countries, CE marking, ISO 9001:2015 manufacturing and a 2-year whole-machine warranty. The SW-P series covers 14 models from 170 kN to 5,500 kN, supports 64-cavity valve-gate hot runner tooling with a dedicated PET screw and far-infrared nano heating coils, and monitors 40+ parameters through the PLC in real time. This article explains which losses dominate preform OEE, how to measure them so they can be attributed, and the order in which to attack them.
Key Takeaways
- Define the time basis before quoting an OEE figure. An OEE that excludes start-up and changeover is a performance indicator for one part of a shift, not a measure of the plant.
- Measure at cavity level. A dead cavity reduces output exactly like a slower cycle, but it is fixed by maintenance rather than by process changes, so it must be counted separately.
- Fix availability before performance. Gains made on cycle time are erased by unplanned stops, and stability is a prerequisite for any credible optimisation.
Benchmark Your Preform Cell Output
Send cycle time, cavity count, shift pattern and reject data — Sailwin engineers return a loss breakdown and the improvement sequence that fits your machine.
1. What OEE Measures on a Preform Cell, and What It Hides
OEE is availability multiplied by performance multiplied by quality, and its usefulness depends entirely on how the three factors are defined for a specific machine. Availability asks what proportion of planned production time the machine was actually available. Performance compares actual output with the output that was theoretically achievable in the time available. Quality compares good output with total output.
The definition traps are predictable. Excluding planned stoppages from availability is legitimate if those stoppages are genuinely required; excluding them because they were inconvenient is not. Using the theoretical cycle from the mould specification rather than the cycle the machine actually achieves inflates nothing but hides everything. And counting preforms that will later be rejected as good output moves a quality loss into a performance gain, which is why reject data must come from the same source as the count.
A preform cell adds one factor that generic OEE models do not handle well: cavities. On a 64-cavity tool, a cavity that is not producing reduces output in exactly the same way as a longer cycle, and the arithmetic makes it invisible. This is why preform OEE should be reported with cavity utilisation as a visible component, and why the machine’s PLC data matters — when 40+ parameters are monitored in real time, a cavity that is not contributing can be identified from the machine rather than inferred from a short count at the end of a shift.
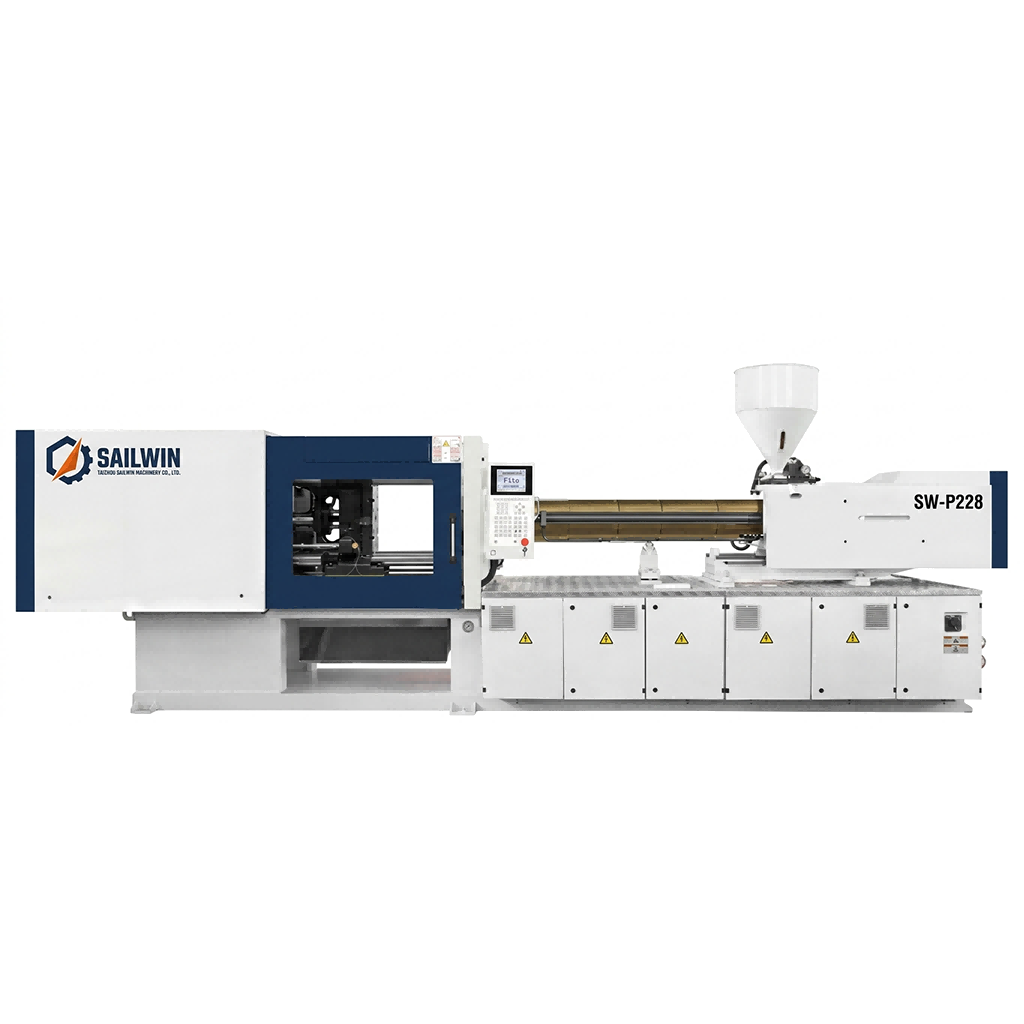
Precision Engineering & Core Components: sw p228 pet preform injection molding machine
2. The Losses That Dominate Preform OEE
Losses in a preform plant disproportionately cluster in three places: start-up and changeover, micro-stops, and cavity-level quality. Each has a different owner, which is precisely why they are often missed — nobody is responsible for the time that falls between production, maintenance and quality.
| Loss | Where it hides | How to measure it |
|---|---|---|
| Start-up and mould change | Written off as setup; excluded from availability | Time from last good preform to first good preform at full cavity output |
| Micro-stops | Below the reporting threshold; not logged as downtime | Count stops under a defined duration from the PLC event log |
| Cavity loss | Appears as a slightly lower count, attributed to speed | Cavity utilisation calculated from part-present signals or weight sampling |
| Cycle inefficiency | Compared against nameplate rather than achievable cycle | Actual versus best recorded cycle for the same mould and resin |
| Quality loss | Rejects found downstream, charged to the blow moulder | Weight, dimensional and acetaldehyde results tied back to cavity number |
| Starved and blocked time | Charged to the upstream or downstream machine | Line-level event log with the initiating device identified |
Note that four of these six losses are measurement problems before they are engineering problems. A plant cannot improve start-up time if nobody records it, cannot reduce micro-stops if they fall below the logging threshold, and cannot recover dead cavities if reject and weight data are not tied to cavity number. The measurement work is unglamorous and it is the whole of the first phase.
3. Availability First: Changeover, Start-up and Micro-Stops
Availability losses are attacked first because they are the largest and the most mechanical. Start-up after a mould change is usually the single biggest block of lost time in a preform plant, and it is almost always recorded as an unavoidable consequence of setting a tool. It is not. Start-up time is the sum of the time needed to reach thermal equilibrium, to establish a valid shot weight across the cavity range, and to take the first quality samples; each of those has levers, and each improves when the previous run left better records behind.
Micro-stops are the loss most likely to be invisible. A machine that stops for forty seconds, three times an hour, loses half a shift across a week while never generating a downtime record that anyone would investigate. The fix is procedural rather than technical: define a stop threshold low enough to capture them, log every stop with its initiating device, and accept that the list will look trivial for the first month. Recurring trivial stops are the raw material of genuine availability improvement.
Planned maintenance reduces unplanned stops, but only if it is planned against condition rather than against the calendar. On a preform tool the hot runner, the cooling circuits and the non-return valve are the three assemblies whose condition determines whether the machine runs to the end of a shift, and all three can be monitored rather than guessed at. A non-return valve that is starting to leak shows up in shot weight stability long before it shows up as a stopped machine; a cooling circuit that is slowly fouling shows up in rising return temperatures.
Half of OEE improvement is usually just measuring the losses honestly enough that someone can be given responsibility for them. The engineering follows the accountability, not the other way round.
4. Performance and Quality: Where Cavity Data Changes the Answer
Once availability is stable, performance losses become addressable. The comparison that matters is not actual cycle against the mould specification but actual cycle against the best cycle the same mould, resin and machine have ever achieved. That reference figure is achievable by definition, which makes the gap an engineering target rather than a theoretical aspiration. It also removes the temptation to buy a machine to close a gap that better cooling balance or a shorter robot handshake would close.
Quality losses in preform production are where cavity-level data earns its place. Weight variation between cavities, acetaldehyde variation, and ovality that appears in a subset of positions all point at specific causes: a hot runner tip condition, a cooling circuit that is not balanced, a thermocouple that has drifted. Without cavity attribution these appear as a plant-level reject rate that cannot be acted on. Sailwin machines support 64-cavity valve-gate hot runner tooling with a dedicated PET screw and far-infrared nano heating coils, and PID temperature control to ±1°C, so the machine side of that measurement is stable enough for cavity-level differences to be meaningful rather than noise from the process.
There is a sequencing rule here that saves money. Cycle-time gains achieved on an unstable process are usually reverted within weeks, because the variation that was always present now breaches the quality gate more often. Establish reproducibility — same weight, same dimensions, cavity to cavity, shift to shift — then reduce cycle time. Plants that skip the first step spend the next year oscillating between two settings.
5. Case Study: Capacity Request That Turned Into a Measurement Project
A preform producer requested a new machine to meet demand, on the basis of a plant OEE figure calculated without start-up time or micro-stops included.
- Reported OEE looked strong because start-up and changeover were excluded from the calculation
- Short stoppages fell below the downtime logging threshold and never appeared in any report
- Cavity-level output unknown; weight and reject data recorded only as plant totals
- OEE redefined with a stated time basis, including start-up and every logged stop
- Stop threshold lowered so short events were captured, then grouped by initiating device
- Cavity utilisation and weight spread added as reported components alongside the standard three factors
- Capacity decision moved from a capital request to a loss-reduction programme
- Recurring micro-stops assigned to specific devices instead of being averaged away
- Cavity-level data available for the first time, so quality losses could be located rather than estimated
Scenario based on a Sailwin customer project; site-specific figures available on request during engineering review.
6. The Improvement Sequence That Works
The sequence below reflects how the three factors depend on each other. It is deliberately ordered so that each step makes the next one measurable, and so that no step depends on capital spending before the cheap options have been evaluated.
- 1. Define OEE with a written time basis. State whether start-up, changeover and planned maintenance are inside or outside the calculation, and report the same definition every month so the trend is comparable.
- 2. Log every stop, including the short ones. Group by initiating device rather than by description, so the list produces maintenance tasks instead of anecdotes.
- 3. Establish cavity utilisation as a reported number. A tool at 56 of 64 positions is a capacity conversation, and it is cheaper than a machine purchase.
- 4. Attack start-up with records, not with speed. The fastest way to shorten start-up is to have the previous run’s settings, hot runner condition and cooling data available on the day.
- 5. Build condition monitoring around the three critical assemblies. Non-return valve, hot runner and cooling circuits, each with a measurable indicator and a trigger for intervention.
- 6. Only then pursue cycle time. Compare against the best cycle ever achieved on that mould, and treat any gap as an engineering target rather than an equipment limitation.
Sailwin supports plants working through this sequence with full-load factory acceptance testing before shipment, installation and commissioning in 3–7 days, common wear parts shipped within 48 hours, and remote engineering support at 7×24. Because the machines monitor 40+ parameters through the PLC in real time, the raw data for an honest OEE calculation is already being produced; the work is deciding who reads it and what they do next.
Turn Your Preform OEE Data Into an Action List
Send cycle time, cavity count, shift pattern and stop data — Sailwin engineers return a loss breakdown ranked by addressable cost.
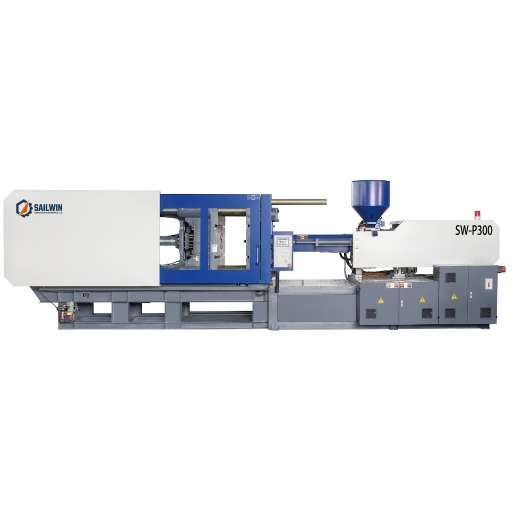
Industrial Machinery Assembly & Workshop: sw p300 pet preform injection molding machine
7. Frequently Asked Questions
Measure the Losses Before You Buy the Capacity
Send your bottle drawing, container sample or target output. Our engineering team replies with a machine recommendation, mould assessment and factory-direct quotation within 24 hours.
Related Reading:
• Injection Molding Machines: SW-P Series 170–5500 kN
• Preform Cycle Time Optimisation
• Preform Production Line Layout
• Preform Mould Trial Checklist
• Energy Consumption of Injection Molding Machines
• Cost per Preform: A Transparent Calculation Model