Most preform plants can tell you what they pay for resin and what their machine cost. Very few can tell you what a good preform costs them, including scrap, energy, mould amortisation and the output they actually achieve rather than the output on the nameplate. That gap is where quoting errors live. A price built on the nameplate cycle and zero scrap is a price that looks competitive and quietly loses money on every order.
The cost of not knowing is not limited to margin. Without a transparent model, every internal improvement discussion becomes an argument about opinions: nobody can show whether a two-second cycle reduction is worth more than a one-gram weight reduction, or whether the energy saving from a servo drive matters at all next to the cost of a percentage point of reject rate. A model turns those into arithmetic, and arithmetic can be decided.
Sailwin has built injection moulding machines for 15+ years, with 500+ machines delivered into 60+ countries, CE marking, ISO 9001:2015 manufacturing and a 2-year whole-machine warranty. The SW-P series covers 14 models from 170 kN to 5,500 kN, supports 64-cavity valve-gate hot runner tooling with a dedicated PET screw and far-infrared nano heating coils, and uses servo drive technology that can reduce energy consumption by up to 30 per cent. This article lays out a cost per preform model you can build in a spreadsheet, shows which assumptions move the answer most, and explains how to use it when quoting bottles.
Key Takeaways
- Build the model per good preform, not per preform produced. Rejects carry the full cost of the material and machine time that made them, so yield belongs in the denominator, not in a note at the bottom.
- Conversion cost is smaller than most buyers expect. Resin and weight dominate, which is why a small weight reduction usually beats a large cycle-time gain.
- Use measured output, not nameplate output. Cavity count multiplied by cycle time only holds when every cavity is producing and the machine is actually running.
Get a Cost per Preform Model for Your Machine
Send the preform weight, cavity count, resin grade and current machine data — Sailwin engineers return a costing structure with sensitivity on the main assumptions.
1. The Six Cost Blocks of a Preform
A complete model has six blocks. Only one of them is material, one is energy, and the other four are the ones usually left out. Each block needs a driver and a data source; if a number cannot be traced to a measurement or a quotation, it should be marked as an estimate rather than quietly averaged into the answer.
| Cost block | Driver | Data you need | Common error |
|---|---|---|---|
| Resin | Preform net weight × resin price per kg | Measured weight per cavity, delivered resin price including freight | Using nominal weight instead of measured cavity average |
| Energy | kWh per kg processed or per 1,000 preforms | Metered machine consumption, tariff structure, dryer and chiller load | Counting only the machine and ignoring drying, cooling and compressed air |
| Labour | Operators and technicians per machine × fully loaded rate | Shift pattern, machines per operator, supervisory and QC allocation | Charging one operator to one machine when the line runs four |
| Capital amortisation | Machine and mould cost recovered over expected lifetime output | Asset cost, expected mould life in cycles, planned hours per year | Recovering the mould over cavity-cycles rather than cycles per tool position |
| Scrap and start-up | Reject rate × (material + machine time), plus every start-up | Reject data per cavity, start-up duration, reclaim value recovered | Treating regrind value as a full credit against virgin resin cost |
| Maintenance and spares | Consumables, spares and service cost per operating hour | Historical spares spend, hot runner component consumption, planned overhaul intervals | Charging total maintenance to conversion and then double-counting it in overhead |
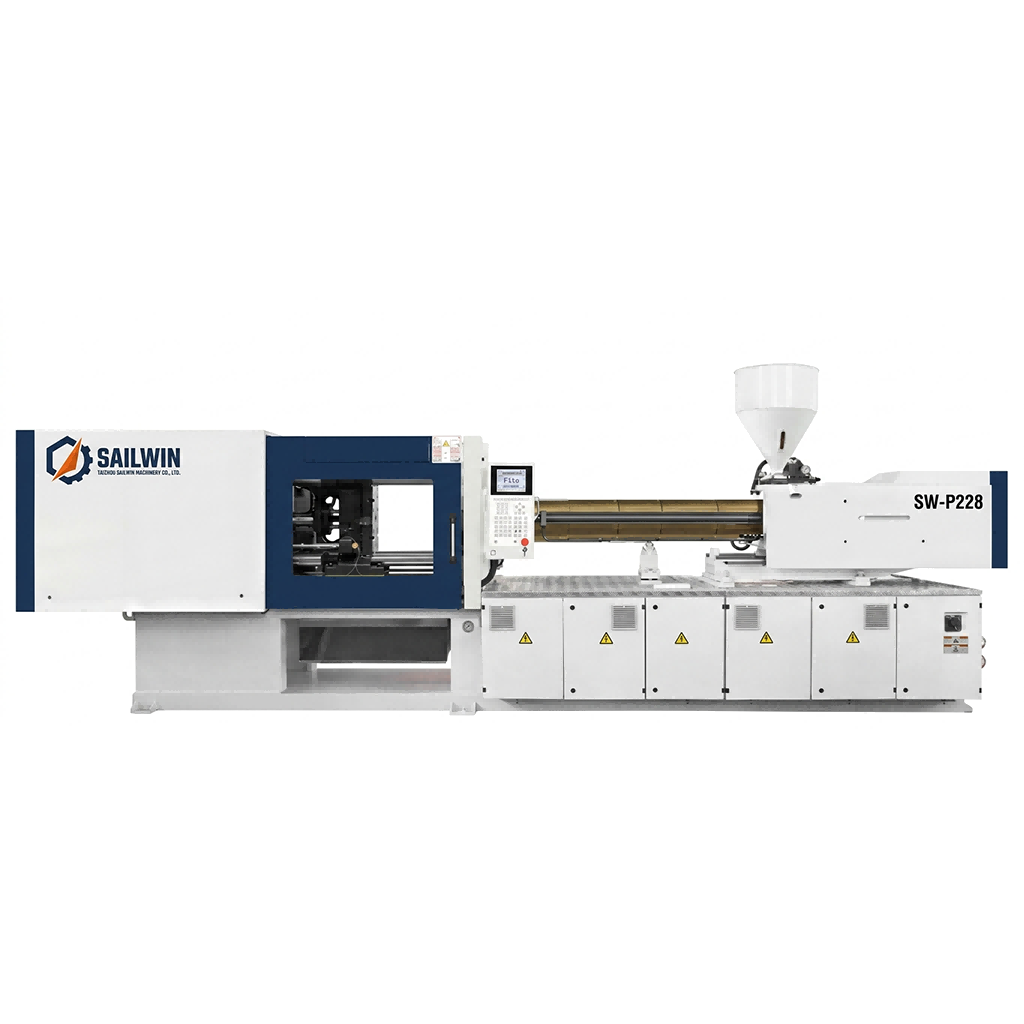
Precision Engineering & Core Components: sw p228 pet preform injection molding machine
2. The Formula, and How Output Really Enters It
The structure is deliberately simple, because a model that cannot be explained to a customer is a model that will be argued with rather than used:
Cost per good preform = ( material + conversion + amortisation + scrap ) ÷ yield
Conversion per preform = machine hour rate ÷ good output per hour
The denominator is where most models go wrong, because output per hour is not cavities multiplied by cycle time. Ideal output is; real output is not. The number that belongs in the model is good output, which means it already includes efficiency, start-ups, stoppages and rejects. On a 64-cavity tool a two-second cycle difference looks trivial in a specification table and becomes significant in a quotation, so the cycle time used in the model should be the one the machine actually achieves across a full shift, not the one recorded during a trial.
Amortisation deserves its own note. A mould is recovered over the number of cycles it can produce, and on a multi-cavity tool that figure is expressed per tool, not per preform — which means a tool running 64 cavities at full utilisation recovers its cost 64 times faster per cycle than the same tool running 40 cavities. Cavity utilisation is therefore a cost variable, and it is one of the few that a well-maintained tool with balanced cooling and a stable hot runner can genuinely protect.
3. A Worked Example Using Illustrative Inputs
The arithmetic below uses round numbers chosen only to show how the blocks combine. They are not Sailwin prices, customer data or market rates, and every figure should be replaced with your own measured values before drawing conclusions.
| Step | Illustrative input | Result |
|---|---|---|
| Ideal output per hour | 64 cavities, 12 s cycle | 64 × 3,600 ÷ 12 = 19,200 preforms/h |
| Good output per hour | 95% effective utilisation | 18,240 preforms/h |
| Resin per preform | 24 g = 0.024 kg at 1.20 per kg | 0.0288 per preform |
| Conversion per preform | Machine hour rate 45.00 (energy, labour, maintenance) | 45.00 ÷ 18,240 = 0.0025 per preform |
| Mould amortisation | Tool cost 250,000 over 50 million preforms | 0.0050 per preform |
| Subtotal per preform | Sum of the three blocks above | 0.0363 per preform |
| Cost per good preform | 3% reject rate applied to the denominator | 0.0363 ÷ 0.97 = 0.0374 per preform |
The teaching point is the ratio. In this structure, resin is roughly 77 per cent of the cost per preform and the entire conversion block — energy, labour and maintenance together — is under 7 per cent. That is why a 5 per cent weight reduction changes the answer more than eliminating all of the cycle time gained by a machine upgrade. It also explains why quoting based on machine efficiency alone is a losing habit: the biggest lever is material, and the biggest risk is yield.
4. Sensitivity: Which Assumptions Actually Move the Answer
A model becomes useful when you change one variable at a time and watch what happens to the total. Using the same illustrative inputs as the worked example, the rankings below are typical of preform costing, and they are not what most production meetings assume.
| Variable changed | Illustrative effect on cost per good preform | How it is controlled |
|---|---|---|
| Preform weight, 24 g → 23 g | Saves 0.0012 per preform, about 3% of total | Design optimisation, gate and hot runner condition, cavity-level weight monitoring |
| Cycle time, 12 s → 11 s | Saves roughly 0.0002 per preform, under 1% of total | Cooling balance, robot handshake timing, melt temperature stability |
| Reject rate, 3% → 4% | Adds about 0.0004 per preform, roughly 1% of total | Cavity-level monitoring, acetaldehyde and dimensional checks from production samples |
| Cavity utilisation, one cavity of 64 out | Raises conversion and amortisation per preform by roughly 1.6% | Hot runner maintenance, cooling balance, mould repair discipline |
| Effective utilisation, 95% → 90% | Raises conversion per preform by about 5.5% of the conversion block | Start-up discipline, spares coverage, planned maintenance, remote diagnostics |
| Resin price, +10% | Adds roughly 0.0029 per preform, close to 8% of total | Contract structuring, resin grade selection, drying and reclaim discipline |
The ranking is the lesson. Weight and resin price dominate; cycle time is a distant third even though it is the variable most often quoted in machine specifications. Conversion efficiency matters, but it matters because it affects amortisation recovery and delivery reliability more than because energy is expensive. A model that shows this stops well-intentioned projects that chase the wrong variable.
Cycle time sells machines. Weight and yield decide whether the preform makes money. A costing model is worth building simply because it makes that difference visible before a quotation is issued.
5. Case Study: Quoting From Nameplate Data
A preform producer quoted bottle prices from nominal preform weight and nameplate cycle time, and found that margin varied sharply between orders placed on the same machine.
- Quotations built on nominal weight and nameplate cycle, with no yield factor anywhere in the calculation
- Same machine producing different margins on different orders with no explanation available
- Improvement projects debated on cycle time because that was the number people could see
- Six-block model built with measured cavity weights, metered energy and historical spares spend
- Reject rate and cavity utilisation entered per order rather than averaged across the plant
- Sensitivity run on weight, cycle, yield and resin price to rank the real cost drivers
- Margin variation between orders became explainable instead of anecdotal
- Improvement effort redirected from cycle time to weight and yield control
- Quotations now carry stated assumptions, so changes in resin or yield are priced rather than absorbed
Scenario based on a Sailwin customer project; site-specific figures available on request during engineering review.
6. Using the Model When Quoting and Buying
A cost model has two customers: the sales team pricing bottles and the engineering team writing a machine specification. Both need the same numbers, and both benefit from the model being explicit rather than intuitive. Sailwin machines support that measurement work directly: 14 SW-P models from 170 kN to 5,500 kN, 64-cavity valve-gate hot runner support, PID temperature control to ±1°C, and PLC monitoring of 40+ parameters in real time, with servo drive technology that can cut energy consumption by up to 30 per cent.
- Rebuild the model monthly from measured data. A model fed with last year’s averages will make this year’s decisions.
- Enter weight per cavity, not one plant average. On a multi-cavity tool the spread between cavities is real cost, and averaging hides it.
- Keep cost separate from price. Freight, terms, tooling contribution and margin are commercial decisions that should be applied to a cost, not blended into it.
- Run three scenarios on every quotation. Base case, resin up with weight drift, and best case. The spread is your risk, and it is better known before the order than after it.
- Charge start-up separately for small orders. Start-up losses and changeover time are per-order costs, and spreading them across a per-preform figure penalises long runs and flatters short ones.
- Show the model to the customer when it helps. A quotation that explains where the cost comes from survives a price challenge far better than one that only states a number.
Used properly, the model also improves equipment decisions. A machine specification that asks for a faster cycle is asking for a small effect. One that asks for stable cavity-to-cavity weight, verifiable hot runner condition and the ability to log process data is asking for the variables that actually decide cost per preform — which is a more useful conversation to have before the order than after it. Sailwin supports that process with full-load factory acceptance testing before shipment, installation and commissioning in 3–7 days, spare parts shipped within 48 hours for common wear items, and remote engineering support at 7×24.
Build Your Cost per Preform Model With Sailwin
Send the preform drawing, cavity count, resin grade and current output data — we return a costing structure, sensitivity ranking and the machine parameters that protect it.
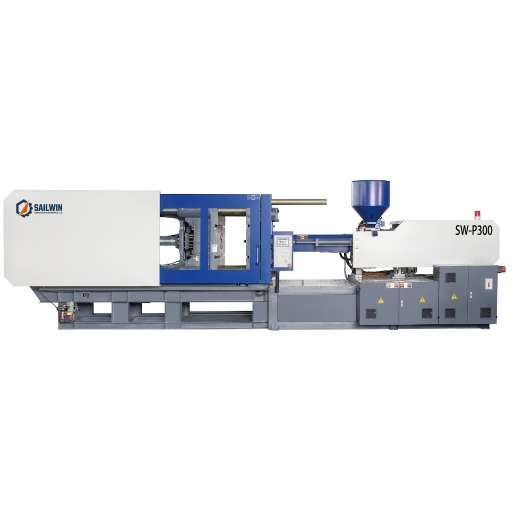
Industrial Machinery Assembly & Workshop: sw p300 pet preform injection molding machine
7. Frequently Asked Questions
Know Your True Unit Cost Before You Quote the Bottle
Send your bottle drawing, container sample or target output. Our engineering team replies with a machine recommendation, mould assessment and factory-direct quotation within 24 hours.
Related Reading:
• Injection Molding Machines: SW-P Series 170–5500 kN
• Preform Weight Tolerance Control
• Energy Consumption of Injection Molding Machines
• Selecting a Preform Injection Molding Machine
• 64-Cavity Hot Runner Preform Mould Technology
• Preform Cycle Time Optimisation